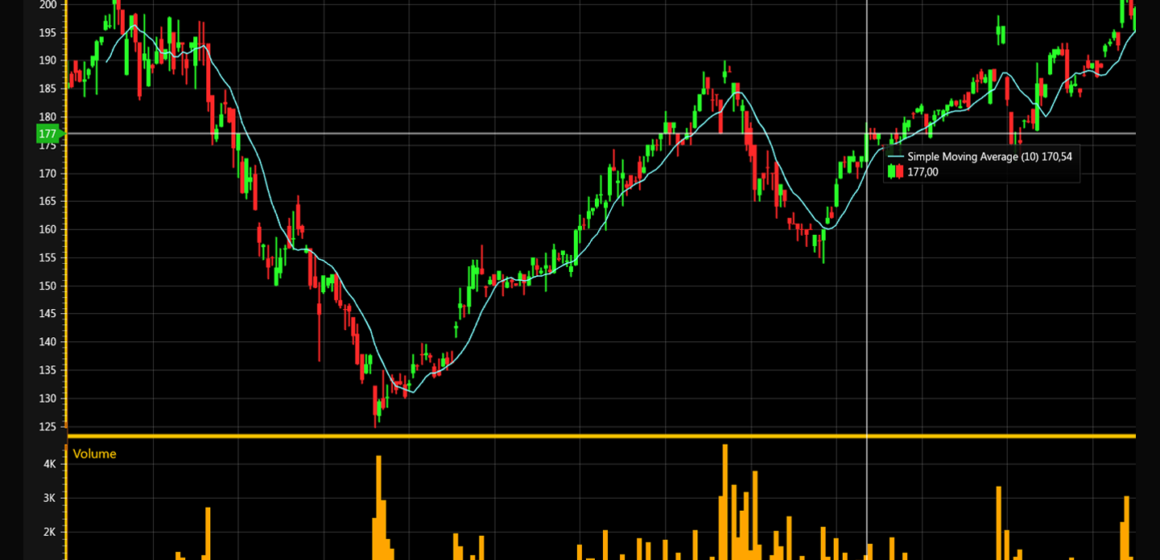
Technical analysis is a method used in trading that examines past market trends to help traders make informed decisions. It involves analysing the price action of an asset, like a stock or currency pair, to determine its future direction. The analysis uses chart patterns and indicators to identify the markets’ apparent and potential entry and exit points. Technical analysis can be used by both short-term and long-term investors alike.
How does the technical analysis process work?
The technical analysis process begins with selecting a chart type to display the data collected from markets. Popular types include bar charts, line graphs, candlestick graphs, and point and figure charts. Each approach has benefits depending on the information needed; that said, all these chart types help traders make informed trading decisions.
Once the chart type is chosen, technical analysts use tools such as trend lines or support/resistance levels to help identify market opportunities. Trend lines identify whether an asset is trending upwards, downwards, or sideways. Support/resistance levels are points where prices tend to reverse; they can be used to predict when prices may start moving in a different direction. With these tools, traders can pinpoint the right time to buy and sell an asset.
In addition to trendlines and support/resistance levels, technical analysts use Moving Average Convergence Divergence (MACD), Relative Strength Index (RSI), and Stochastics Oscillator indicators. These indicators measure momentum, price trend direction, and support/resistance levels. By using these indicators together, traders can better determine the strength or weakness of a potential trade setup.
Traders in Singapore should use risk management techniques to limit their losses when trading. Risk management involves setting up stop-loss orders and automatically closing out a position if the market moves against your position by a certain amount. Additionally, traders should set target prices for their trades to ensure they take profits at suitable intervals.
What are the benefits of using technical analysis?
The primary benefit of technical analysis is that it can help Singaporean traders make more informed decisions. By analysing past price actions, traders can better identify potential market entry and exit points. Technical analysis also helps traders identify trends in the market, as well as support/resistance levels which could indicate when prices may start moving in a different direction.
Another advantage of using technical analysis is that it helps to reduce risk when trading stocks by setting up stop-loss orders and taking profits at suitable intervals. It allows traders to limit their losses while still having the opportunity to capitalise on lucrative trades.
Technical analysis also provides a variety of indicators which measure momentum, trend direction, and support/resistance levels. These indicators provide valuable insight into potential trade setups which can help increase profitability over time. Lastly, technical analysis does not require complex mathematical formulas or large amounts of data; it relies on simple chart patterns and tools such as trend lines or MACD indicators to inform trading decisions.
What are the risks?
Despite the various benefits of using technical analysis, there are some risks that traders should be aware of. One risk is that technical analysis relies on past data. It may only sometimes accurately predict future market movements. Additionally, indicators such as RSI or MACD may generate false signals, leading to losses if acted upon.
Another risk with technical analysis is that chart patterns and indicators do not consider fundamental factors such as economic news releases or geopolitical events, which can significantly impact prices. Traders must stay current with current events and factor these into their trading strategy to make informed decisions.
Relying too heavily on technical analysis for trading decisions can cause overtrading, meaning traders take too many positions and fail to close them out in time, resulting in losses. Lastly, chart patterns may become repetitive or cyclical, so traders should be aware of trends and adjust their trading strategy accordingly.
Conclusion
Technical analysis is a powerful trading tool for making informed decisions when trading. It allows traders to identify entry/exit points and assess market momentum. However, it’s vital to remember that there are risks involved with technical analysis, and traders should always use risk management techniques like stop-loss orders and target prices. With the right approach, technical analysis can help increase potential returns over the long run.
Support Zerocrypted
- Trade on Bitmex
- Trade on Binance Jersey
Subscribe to our Newsletter to be a part of our future $1,000 per month contests.


